Social Media Analytics Dashboard
Every week, Actionbook reads your YouTube, TikTok and Instagram analytics with your login and builds one report: followers, views and engagement for each platform, the change from last week and your top posts.


Built for
- Creators posting on YouTube, TikTok and Instagram every week
- Creator managers sending a weekly report to their clients
- Founders tracking which channel grows their audience
Key insights
- Followers on each platform with the change from last week
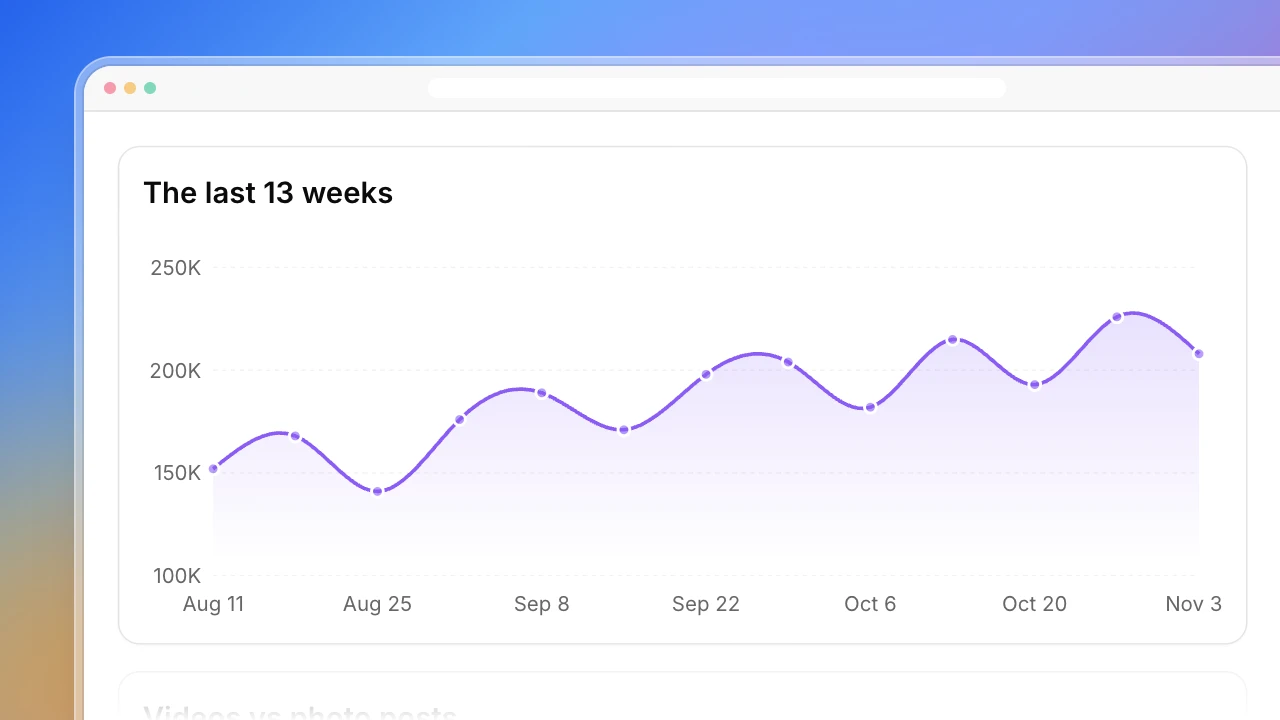
- One platform at a time: 8 weeks of growth beside this week’s numbers
- Each metric against last week and the 4-week average
- Top three posts on each platform this week
- A weekly log that grows with every run
What is the social media analytics dashboard?
A social media analytics dashboard puts the numbers from every platform you post on into one view, so you can see what moved this week without opening each app. This one covers YouTube, TikTok and Instagram. Actionbook reads each platform’s own analytics in your browser and keeps every metric under its own definition, so YouTube views, TikTok views and Instagram reach are never added together. Each number is compared with last week and with your 4-week average, so one odd week stands out. The dashboard also lists your top three posts on each platform and keeps a weekly log, which makes it a social media dashboard and a creator analytics record in one. The first run sets the baseline.
How to build a social media analytics dashboard
Building a social media analytics dashboard for your own accounts takes five steps. The dashboard above follows them.
1. Pick a few numbers for each platform
Audience size, reach and one engagement number per platform is enough. Use each platform’s own definition, such as YouTube views or Instagram accounts reached.
2. Keep the platforms apart
A YouTube view, a TikTok view and an Instagram account reached aren’t the same unit. Give each platform its own rows and never add them up.
3. Compare with last week and a 4-week average
Last week shows the change. The average of the four weeks before shows whether that change is unusual or just noise.
4. Put the top posts next to the numbers
The three posts that reached the most people explain most weeks. Link each one, and treat the link between a post and a number as an observation, not a cause.
5. Log every week
Add each week’s numbers to a running history. Without an earlier record, the first week becomes the baseline.
Who the social media analytics dashboard is for
Creators on more than one platform
You post on YouTube, TikTok and Instagram, and checking three apps every Monday takes too long.
- Followers and reach on each platform
- What changed since last week
- Your top posts in one place
Creator managers and small teams
You report a creator’s week to them or to a client and need the same numbers every time.
- One report each week at the same link
- Each platform’s own metrics
- A weekly log for monthly reviews
Founders building an audience
You grow an audience alongside your product and want to see which channel is moving.
- Net new followers per platform
- Your 4-week average as the bar
- Engagement next to reach
How the social media analytics dashboard works
Step 1: Click Build with Actionbook and list your accounts
Your YouTube channel, TikTok account and Instagram account. If you leave one out, it asks before it starts.
Step 2: Stay signed in to each platform
Actionbook reads YouTube Studio, TikTok Studio and your Instagram professional dashboard in your browser. It only reads: it doesn’t post, edit or change any setting.
Step 3: Schedule it every Monday
Each run adds a week to the log at the same link. Scheduled runs happen while the Actionbook extension is online.
Social media analytics dashboard FAQ
What is a social media analytics dashboard?
One page that shows your numbers from every platform you post on: audience, reach and engagement, with the change over time. It saves opening each app’s analytics and copying numbers into a spreadsheet.
Is this a social media dashboard or a report?
Both. Each run is a weekly report for one week, and the runs add up to a social media dashboard with eight weeks of growth and a log you can look back on.
What does creator analytics cover here?
The numbers a creator checks each week: followers, net new followers, views and engagement, plus the posts that reached the most people. Audience demographics and earnings aren’t included.
Why aren’t the platforms added together?
Each platform counts in its own way. A TikTok view starts sooner than a YouTube view, and Instagram counts accounts reached, not views. Adding them would hide which platform moved, so each is compared only with itself.
Which platforms does it support?
The example covers YouTube, TikTok and Instagram. Ask for X, LinkedIn or Facebook in the chat and it reads those the same way, with your login.
What if I have no record from last week?
The first run becomes the baseline. From the second run on, every number gets its change from last week, and from the fifth run on, a full 4-week average.
Does it change anything on my accounts?
No. Actionbook only reads your analytics pages. It doesn’t post, edit, reply or change any setting.
Does it say why my numbers changed?
It shows the top posts next to the numbers, so you can see what was out that week. It writes those links as observations, not causes.