Client Reporting
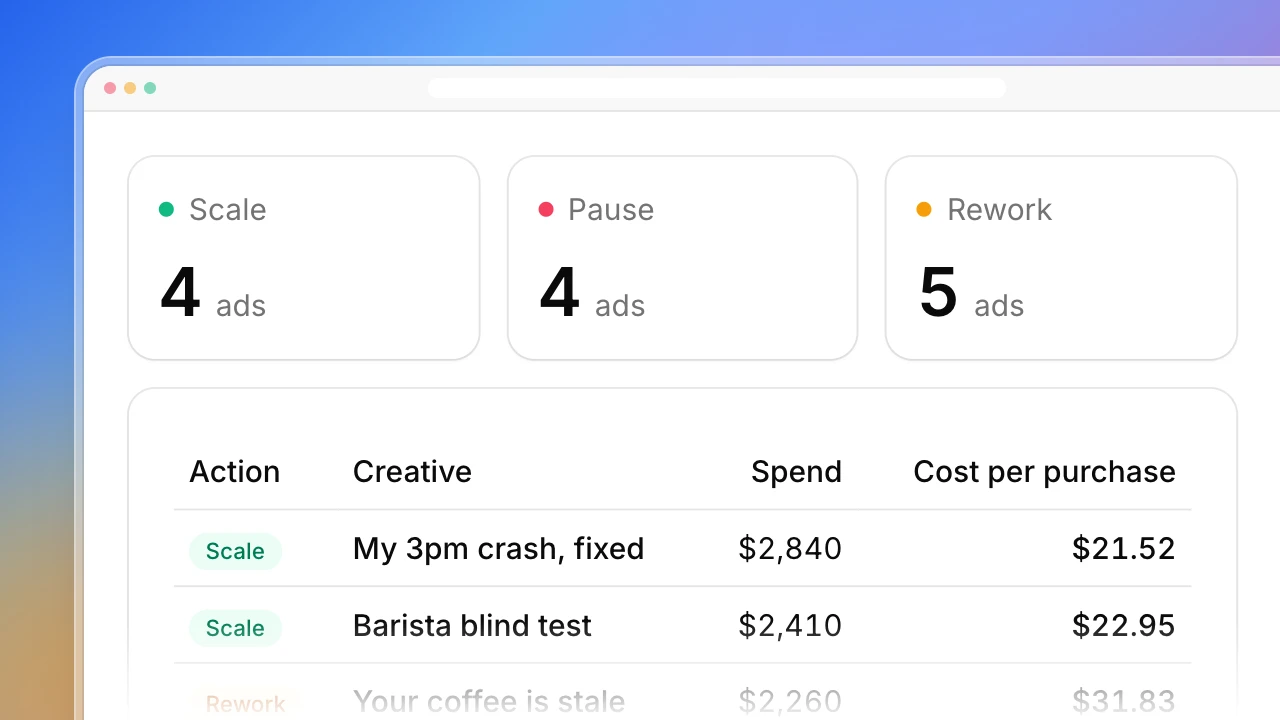
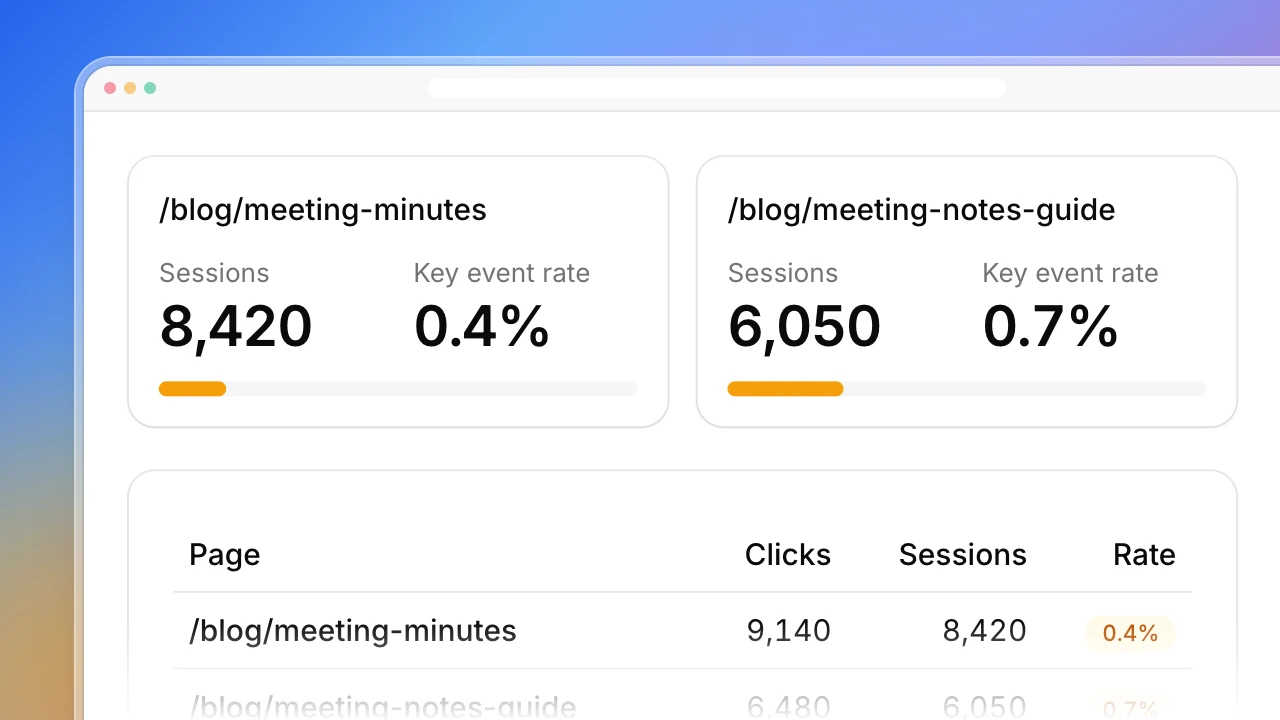
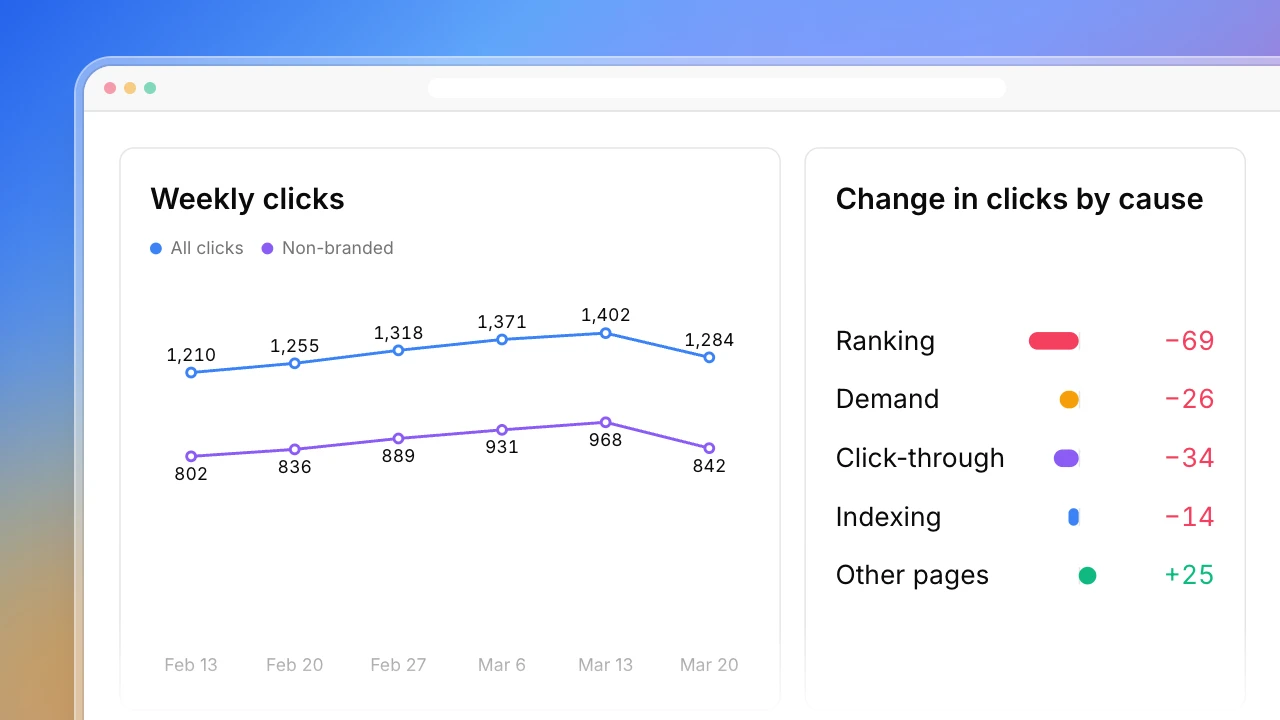
Every month, each client expects the same thing: what happened, why, and what you’ll do about it. Actionbook reads the client’s Google Analytics, Search Console, Google Ads and Meta Ads, compares last month with the month before, and writes the report around the answer.



Built for
- Freelancers sending monthly reports to a handful of clients
- Small agencies that want every client report in the same shape
- In-house marketers who owe a founder one page each month
Key insights
- What changed last month, why, and what to do next
- Sessions, conversions, revenue, spend and cost per conversion against the month before
- Every channel on one row, paid and organic
- Google Ads and Meta side by side, with the top campaigns
- The drivers behind the change, each with its numbers and source
What is the client reporting dashboard?
Client reporting is the regular report an agency or freelancer sends each client to show what their marketing did and what happens next. Actionbook reads the client’s GA4, Search Console, Google Ads and Meta Ads Manager, compares the last full month with the month before, and writes what changed, why, and what to do next. For agency reporting, run it once per client. It works as a client reporting tool with no data pipeline to set up.
How to build a client report for marketing
A monthly client report takes five steps. The dashboard above follows them.
1. Fix the period and the comparison
Use the last full month against the month before, with the same dates in every tool.
2. Pull each source on its own
Sessions and conversions from GA4, clicks and queries from Search Console, spend and conversions from each ad platform.
3. Keep conversion counts apart
GA4 and the ad platforms attribute differently. Label each count with its source and never add them.
4. Write the readout first
Three sentences: what changed, why, what next. Then pick the numbers that back them.
5. End with actions
Tie each one to a change in the numbers, so the client sees why it’s on the list.
Who the client reporting dashboard is for
Freelancers with a handful of clients
You do the work and the reporting, and the report eats a day each month.
- One report per client from the same prompt
- The readout drafted for you to edit
- Next month’s actions tied to the numbers
Small agencies
Account managers build each report by hand, and no two look the same.
- The same nine sections for every client
- GA4 and ad-platform conversions labeled, never added
- A link per client in place of a deck
In-house marketers reporting up
Your founder wants one page on how marketing did, not four dashboards.
- Six KPIs with the change from last month
- What drove the change, with the source
- Three actions for next month
How the client reporting dashboard works
Step 1: Click Build with Actionbook and name the client
The last full month against the month before by default. Ask for another period instead.
Step 2: Stay signed in to the client’s four tools
Actionbook reads Google Analytics, Search Console, Google Ads and Meta Ads Manager the way you see them in your browser. If you have connected Google Analytics, it reads GA4 through the connector. It changes nothing in any account.
Step 3: Run it again next month
Each run compares the new month with the one before, in the same nine sections.
Client reporting dashboard FAQ
What is client reporting?
The regular report an agency or freelancer sends a client to show what their marketing did: the results, what changed since the last period, why, and what happens next. Most are monthly. A good one leads with the answer and keeps the charts as evidence.
Can I use it for agency reporting across several clients?
Yes. Run it once per client. Each run reads that client’s accounts and makes its own dashboard at its own link, with the same sections in the same order.
Is this a client reporting tool or a template?
It builds a live dashboard from the client’s own accounts. There is no file to download and fill in.
Which sources does it read?
Google Analytics 4, Google Search Console, Google Ads and Meta Ads Manager. If a client doesn’t use one, the report says so in the data notes and leaves that section out.
Why are GA4 conversions and ad-platform conversions shown separately?
They count differently. GA4 credits a conversion to one channel by its own attribution. Each ad platform counts every conversion it can claim. One sale can show up in both, so the report labels each count and never adds them.
How is this different from the Google & Meta Ads and Search Console playbooks?
Those go deep on one thing: an ad account week by week, or search performance week by week. This is the monthly report across all channels, where ads and SEO are each one section. The Social Media Analytics playbook covers organic social, which this report leaves out.
Can it send the report or export a PDF?
No. It builds the dashboard at a link. You share the link with the client yourself.
Does it change anything in my accounts?
No. It only reads.