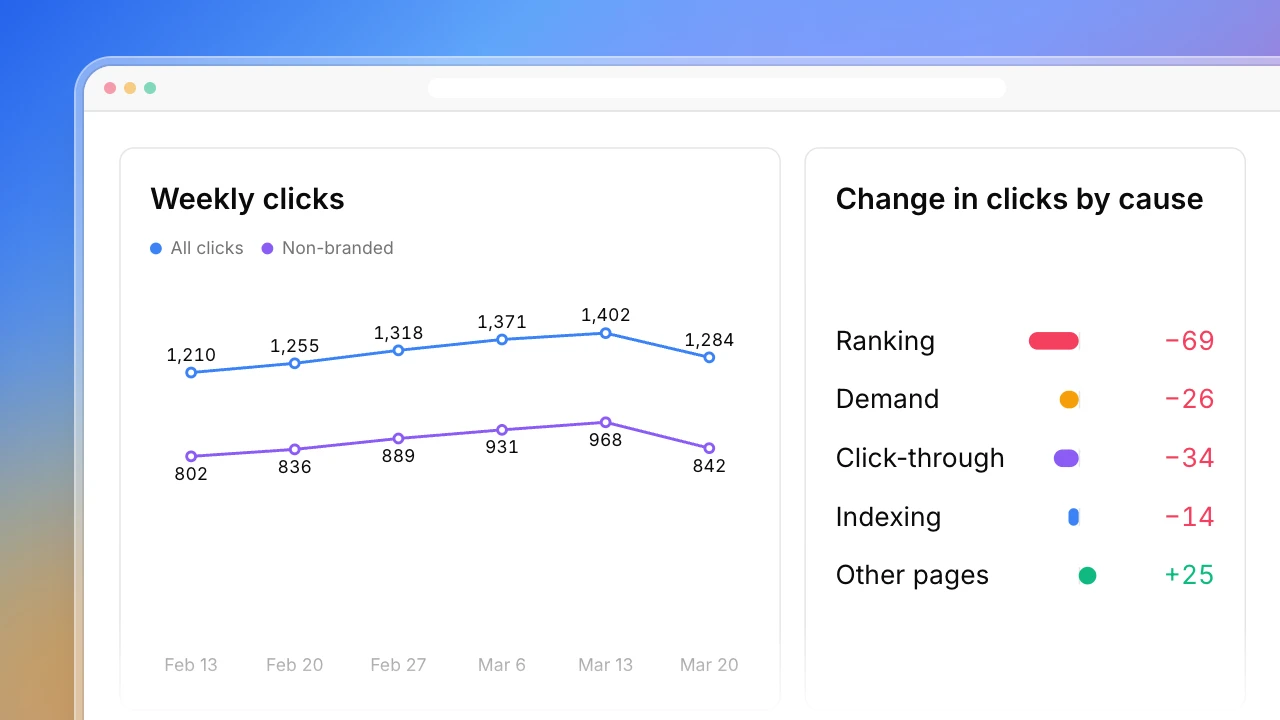
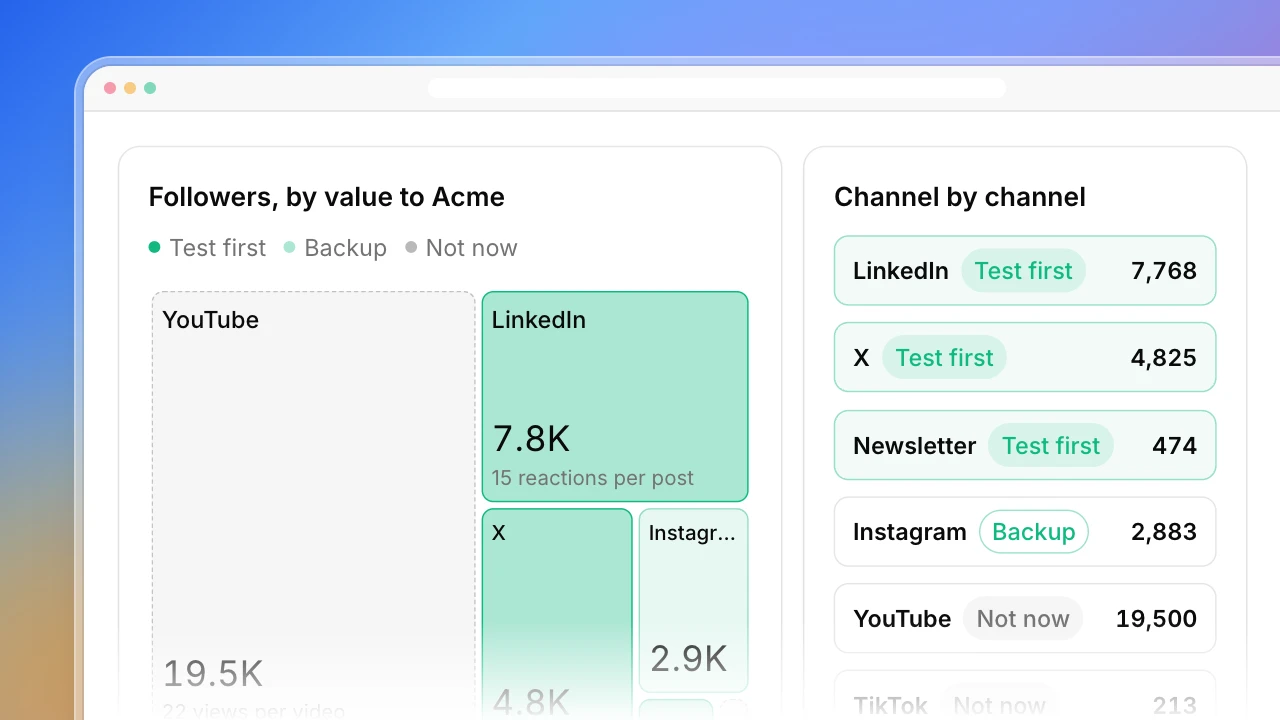
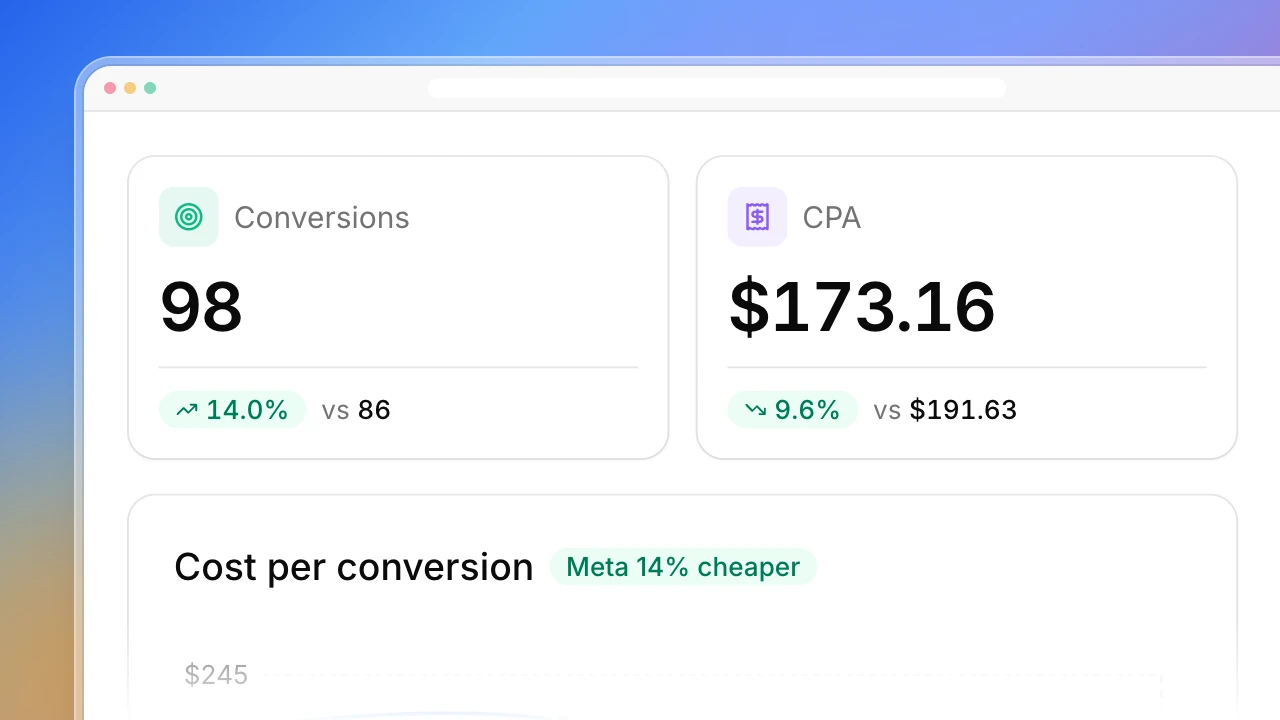
Landing Page Analysis
Actionbook reads your Google Analytics and Search Console with your login and puts every landing page on one row: how it does in search, how many sessions it starts and how often those sessions convert. Pages with plenty of traffic and a low key event rate come first.


Built for
- Content marketers checking which organic pages bring sign-ups
- Growth leads picking which pages to test next
- Founders reading GA4 and Search Console in one place
Key insights
- High-traffic landing pages with a low key event rate
- Sessions against key event rate for every page
- Search Console clicks, impressions and position beside GA4 sessions and key events
- How each tool counts, and how many pages matched
What is the landing page analysis?
Landing page analysis compares the pages where visits start: how much traffic each one gets and how often that traffic converts, so you know which page to fix first. Actionbook reads your Search Console performance report and GA4 Landing page report in your browser, matches them by URL and marks the pages with many sessions and a low key event rate. It puts landing page analytics from both tools in one table. Landing page conversion rate here is GA4’s session key event rate for your key event.
How to do a landing page analysis with Google Analytics and Search Console
A landing page analysis takes five steps. The dashboard above follows them.
1. Pick one period and one key event
Use the same dates in both tools, and end the period two or three days ago, because Search Console data for the most recent days is not final. Write down which GA4 key event counts as a conversion, such as sign_up or purchase.
2. Get the search numbers by page
In Search Console, open the Performance report and the Pages tab. Note clicks, impressions and average position for each URL.
3. Get sessions and key events by landing page
In GA4, open the Landing page report and filter it to sessions from Google organic search, so it lines up with Search Console. Note sessions, users, session key event rate for your key event, and revenue.
4. Match the two by URL
Search Console lists full URLs and GA4 lists paths. Take the domain off, then match the rows. Count the pages that did not match instead of dropping them.
5. Sort by traffic, then read the rate
Use the session key event rate: the share of sessions that included the key event, not the event count over sessions. A page with more sessions than the median and a rate under half the site’s is the first one to fix.
Who the landing page analysis is for
Content and SEO marketers
Your pages bring in search traffic, and you have to show which of it turns into sign-ups or sales.
- Search and conversion numbers on one row per page
- High-traffic pages with a low key event rate
- Each page’s rate against the site’s
Growth leads
You run a few tests a month and need to pick the pages where a lift pays off most.
- Pages ranked by sessions with their rate beside it
- Every page as a dot: sessions against rate
- Purchase revenue where GA4 records it
Founders and small teams
You keep GA4 and Search Console open in two tabs and have no time to join them by hand.
- One table from both tools
- The key event named on the dashboard
- Unmatched pages counted, not dropped
How the landing page analysis works
Step 1: Click Build with Actionbook and name your site
The last 28 days by default. Ask for the last 90 days or your own dates instead.
Step 2: Stay signed in to Google Analytics and Search Console
Actionbook reads the reports you can already open in your browser. No API keys, connectors or spreadsheet exports.
Step 3: Pick the key event if it asks
Actionbook reads the key events set up in your GA4. With one, it uses it. With several, it lists them and asks which one counts as a conversion.
Landing page analysis FAQ
What is landing page analysis?
Comparing the pages where visits start, by how much traffic each gets and what visitors do next. It shows which pages bring people in and which turn those visits into sign-ups or sales, so you know where your next fix pays off.
What landing page analytics does it show?
From Search Console: clicks, impressions and average position for each page. From GA4: sessions, users, key events and session key event rate, plus purchase revenue when your property records it.
How is landing page conversion rate calculated?
It uses GA4’s session key event rate: sessions that started on the page and included your key event, divided by all sessions that started there. Actionbook reads the key events set up in your property and asks which one to use when there are several.
Why don’t Search Console clicks match GA4 sessions?
They count different things. Search Console counts clicks on Google Search results. GA4 counts the sessions it could measure, and one click can become no session or more than one. The dashboard keeps the two side by side and never adds them into one funnel.
Which pages does it mark?
Pages with more sessions than the median page and a key event rate under half the site’s rate. Ask for a different threshold in the chat.
How is this different from the Search Console Weekly Performance playbook?
That one compares this week with last week in Search Console and explains why clicks moved. This one covers a single period, adds GA4, and ranks landing pages by how well their traffic converts.
Does it score my page’s design or copy?
No. It tells you which pages to look at first, from your own traffic and conversion data. It doesn’t grade headlines, speed or layout.
What if my site has no purchases in GA4?
Then revenue is left out. The key event rate works with any key event, such as a sign-up, a demo request or a form submit.